
Enter TitleJAR TEST WITH B-KER2 SQUARE JARS
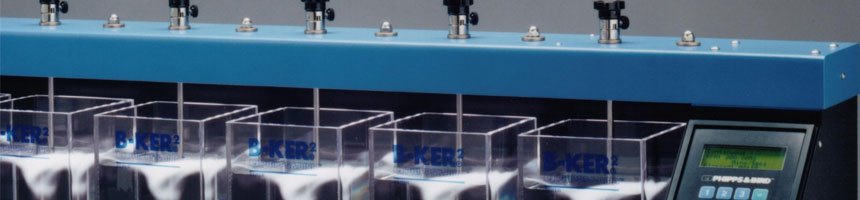
The procedures employed depart from the traditional jar testing in the jars used, sampling procedure and use of the data. The dimensions of the two liter B-Ker2 jar are given in Figure 1. The effectiveness of the various treatment processes is determined by the turbidity of samples taken during the settling cycle. These turbidity data are used to plot settling velocity distribution curves. The curves provide information on clarification over a wide range of basin loadings for each specific treatment applied to the B-Ker2 jar.
The testing begins the same as the traditional jar test — to determine the optimum dosage. That is, the dosage which produces the best clarification upon settling. It is here where this method with the B-Ker2 jars begins to show its advantages. The samples for turbidity measurement are always taken from the same depth, without disturbing the remainder of the jar. Secondly, turbidity samples are taken over a time period which covers all conventional and most solids contact settling basin loadings.
Settling basin loadings are expressed in units of volume per unit of area per unit of time or in the metric system meter cubed per meter squared per unit of time. The English system would be gallons per square foot per unit of time. The system adopted is the metric for ease and convenience. Meters cubed per meter squared per minute, m3/m2/min, is a settling velocity – m/min. The B-Ker2 jar is designed to provide a convenient settling distance – 10 cm. It is simple and easy to use.
Most conventional rectangular basins are designed for a surface loading or overflow rate of from 2 to 5 cm/min. (0.5 to 1.25 gal/ft2/min). The older plants would be more like 2 to 3 cm/min. Solids contact basins might go as high as 10 cm/min. In any case:
and cm/min. readily translates into a basin loading. This is meaningful information for plant operation and design. This system makes the results of jar testing comparable from day to day, week to week or month to month no matter who is doing the test. The data is useful in improving plant performance and the design of plant expansion or a new plant using this same raw water.
If for example a turbidity sample is drawn off after 5 minutes of settling the turbidity remaining in the 10 cm above the sampling tap will have a settling velocity of less than 2 cm/min. that turbidity which has passed the sampling tap will have had a sample turned out to be 2.5 NTU, and succeeding tests confirmed this, it would be good design and operation information: For the designer who wanted settled water in this range to apply to the filters, he could go forward on the basis of a pretreatment (dosage, mixing and flocculation) given these jars and a settling basin with a loading of 2 cm/min. or -.5 gal/ft2/min. For operation the operator should compare the settled water turbidity coming from his settling basins with the jar test data. If the basins for example, were producing settled water of say 6 or 7 NTU, then the operator would know that improvements were possible. He would then have to compare his pretreatment with that given the jars in the testing and find the place in the process where improvements could be made. If the problem was found to be in the process he could make the modifications. If the problems were in the design he would call on the engineering department for help. Operation problems might be:
- Coagulant being applied in a concentrated state instead of dilute. Many plants, perhaps most, apply liquid alum or liquid ferric chloride as received from the supplier.
- Coagulant being applied at a point of low agitation. Quick and total mixing of the raw water and the coagulant is very important.
- Applying a polymer or alkali in the wrong sequence.
- Applying a polymer at the wrong point in the process or too concentrated.
- Improper energy input in the flocculation cycle. Usually flocculation systems have flexibility in energy input and the speeds can be adjusted to approach the optimum.
In design the problems may be:
- The system of the initial dispersion of the coagulant, rapid mix, may be applying low agitation so that structural or mechanical changes may be required.
- Short circuiting may be occurring in the flocculation system. New baffling or compartmentation may be required.
- Floc may be being sheared in flowing from the flocculation system to the settling basin because of agitation in transmission.
- Settling basins may be short circuiting because of entrance or outlet design.
Obviously other problems can and do occur. The important point is that with good jar testing and the data obtained, problems can be identified and improvements made.
In order to determine accurately the settling characteristics of the treated sample, the first step is to determine the turbidity of the raw water. Then after giving this water a specific treatment (chemical dose, mixing, and flocculation), the settling cycle begins and samples are removed after 1, 2, 3, 5, and 10 minutes of settling. These times correspond to 10, 5, 3.3, 2, and 1 cm/min. settling velocities. Obviously the 1 minute sample will have the highest turbidity while the 10 minute sample will have the lowest. The amount of the difference, however, can vary widely depending on the effectiveness of the treatment applied. Since there are many variables involved, the testing must proceed by changing only one variable in each jar for each test. Then by the process of elimination or selection, the optimum treatment will emerge.