


NEW! Cardiocomp 3D™
is a dramatic enhancement to Cardiocomp® that provides a visually simple presentation of complex electrocardiography data. Using data from Cardiocomp 7™ and applying ECG Tech’s 3D algorithms*, a complete 3D projection of a subject’s electrocardiograph can be displayed. This technology has been published in the latest edition of Marriott’s Practical Electrocardiography, Chapter 4.* Under license to Phipps & Bird, Inc. by ECG-Tech Corp.
Offer students an elevated electrocardiograph educational experience with Cardiocomp3D™!
Please enjoy a copy of ECG INTERPRETATION USING 3D GRAPHICS by Bill Olson
To view a short video of Cardiocomp 3D’s features, Click here

Cardiocomp 3D and the Olson Vectorgraph module
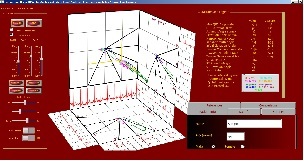 Cardiocomp 3D full screen 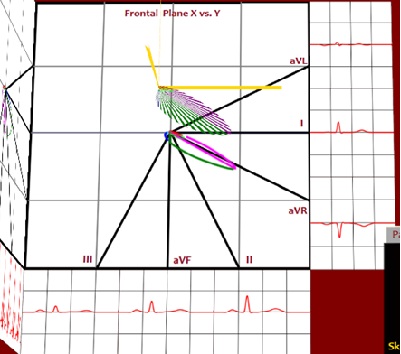 The Standard Frontal Plane view provide by the limb leads 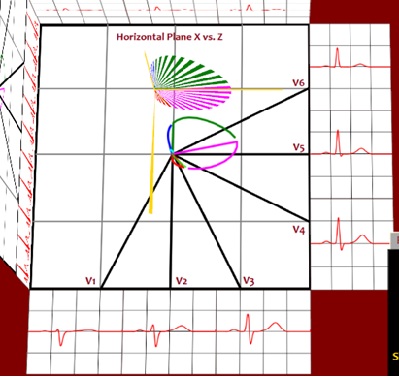 The Horizontal Plane provided by the chest lead 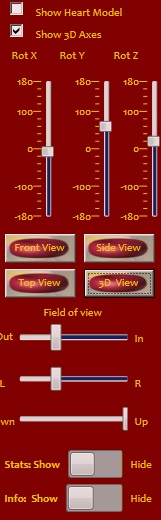 Full visual controls 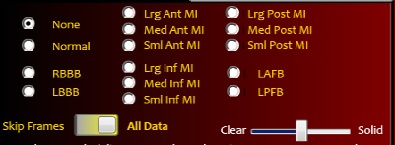 List of comparative pathologies & normal
|
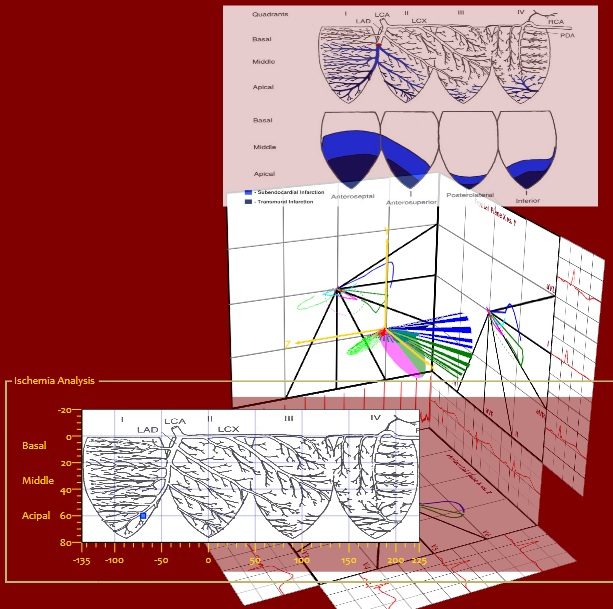
By using the chest lead along with the Olson 3D Vector module, cardiocomp can provide an information-rich display of the entire heart’s electrical activity. Students can quickly see a full view from any angle. In addition, a 3D model of a heart can be placed in space to help provide a reference to the vectors they are studying. Color coding of the vectorgraph will help understand the timing.
A spatial understanding of myocardial activation obtained via an instructional software program will improve the capability to comprehend the relationship between the heart electrical activation waveform, the 12 lead ECG QRS complex and the associated vectorcardiogram (VCG). These new methods are based on developing a sound understanding of the spread of the electrical excitation sequence through normal & infarcted myocardium (heart muscle). Features:
Call for a free trial copy (804) 254 2737 x218 A quote from Chapter 4 of the current ‘Marriott’s Practical Electrocardiography’ “… the fundamental electrical process at the myocardial cellular level is the basis for all electrical information transmitted to the body surface. The three-dimensional Catalog:
|